1. 1. Acces to IPM Source from OpenAlea python
Access to notebook https://github.com/H2020-IPM-openalea/weatherdata/blob/refactoring/example/Weather_demonstration.ipynb
[2]:
import pandas
pandas.set_option('display.max_rows',10)
pandas.set_option('display.max_colwidth',None)
import logging, sys
from weatherdata import WeatherDataHub
2. 1.1 Access to IPM Catalog and IPM list of weather parameters
[3]:
ws= WeatherDataHub()
ws.list_resources
[3]:
| name | description | parameters | |
|---|---|---|---|
| 0 | Met Norway Locationforecast | 9-day forecasts for the entire planet. 2.5 km resolution in the Nordic-Baltic region, 9km elsewhere | {'common': [1001, 3001, 2001, 4002], 'optional': None} |
| 1 | Met Éireann Locationforecast | 9-day forecasts for Ireland. | {'common': [1001, 3001, 2001, 4002], 'optional': None} |
| 2 | DMI Pointweather service | Seasonal weather data and forecasts for Denmark. Grid based | {'common': [1002, 1112, 2001, 3002, 3101, 4002], 'optional': None} |
| 3 | SLU Lantmet service | Seasonal weather data and forecasts for Sweden. Grid based | {'common': [1002, 1003, 1004, 2001, 3002, 3003, 3004, 4003, 5001], 'optional': None} |
| 4 | Deutsche Wetterdienst location forecast by IPM Decisions | 27 hour weather forecasts for Germany and surrounding areas. 2.5 km resolution. Pulls data from DWD's Open Data server (https://www.dwd.de/EN/ourservices/opendata/opendata.html). Made available by a custom adapter created by Met Norway and NIBIO. | {'common': [1001, 3001, 2001, 4002], 'optional': None} |
| ... | ... | ... | ... |
| 10 | Landbruksmeteorologisk tjeneste | Weather station network covering major agricultural areas of Norway. Data before 2010 are available by request. Email lmt@nibio.no | {'common': [1002, 1003, 1004, 3002, 2001, 4003], 'optional': [3101, 5001]} |
| 11 | MeteoBot API | Network of privately owned weather stations. Access requires permission from each weather station's owner | {'common': [1001, 3001, 2001, 4002], 'optional': None} |
| 12 | Fruitweb | Network of privately owned weather stations of several types; Davis, Metos and self manufactured. Access requires permission from each weather station's owner | {'common': [1001, 3001, 2001, 4002], 'optional': None} |
| 13 | Metos | Network of privately owned weather stations of several types; Davis, Metos and self manufactured. Access requires permission from each weather station's owner | {'common': [1001, 3001, 2001, 4002], 'optional': None} |
| 14 | Meteodata by Météo Concept | Weather station network covering all of mainland France, with a specially high density of agricultural stations in Brittany. Visit www.meteodata.fr and www.meteo-concept.fr or email us at contact@meteo-concept.fr | {'common': [1001, 2001, 3001, 4001, 4003], 'optional': [1003, 1004, 1021, 1101, 1131, 3003, 3004, 3101, 5001]} |
15 rows × 3 columns
[4]:
ws.parameters
[4]:
| id | name | description | unit | aggregationType | |
|---|---|---|---|---|---|
| 0 | 1001 | Instantaneous temperature at 2m | None | Celcius | AVG |
| 1 | 1002 | Mean air temperature at 2m | None | Celcius | AVG |
| 2 | 1003 | Minimum air temperature at 2m | None | Celcius | MIN |
| 3 | 1004 | Maximum air temperature at 2m | None | Celcius | MAX |
| 4 | 1021 | Instantaneous temperature in canopy | None | Celcius | AVG |
| ... | ... | ... | ... | ... | ... |
| 38 | 4012 | Instantaneous wind speed at 10m | None | m/s | AVG |
| 39 | 4013 | Mean wind speed at 10m | None | m/s | AVG |
| 40 | 4014 | Max wind speed at 10m | None | m/s | MAX |
| 41 | 4015 | Min wind speed at 10m | None | m/s | MIN |
| 42 | 5001 | Solar radiation (Q0) (W/sqm) | None | W/sqm | SUM |
43 rows × 5 columns
3. 1.2 Get a ressource, access to meta-information of this ressource
3.1. 1.2.1 get ressouce
[5]:
fmi = ws.get_ressource(name="Finnish Meteorological Institute measured data")
3.2. 1.2.2 Meta-informations of the ressource
3.3. 1.2.2.1 List of parameters
[6]:
fmi.parameter
[6]:
| id | name | description | unit | aggregationType | |
|---|---|---|---|---|---|
| 1 | 1002 | Mean air temperature at 2m | None | Celcius | AVG |
| 20 | 2001 | Precipitation | None | mm | SUM |
| 22 | 3002 | Mean RH at 2m | None | % | AVG |
| 34 | 4003 | Mean wind speed at 2m | None | m/s | AVG |
3.4. 1.2.2.2 list of stations
[7]:
fmi.stations
[7]:
| name | id | latitude | longitude | |
|---|---|---|---|---|
| 0 | Alajärvi Möksy | 101533 | 24.26 | 63.09 |
| 1 | Asikkala Pulkkilanharju | 101185 | 25.52 | 61.27 |
| 2 | Enontekiö Kilpisjärvi Saana | 102017 | 20.85 | 69.04 |
| 3 | Enontekiö Kilpisjärvi | 102016 | 20.79 | 69.05 |
| 4 | Enontekiö Näkkälä | 102019 | 23.58 | 68.60 |
| ... | ... | ... | ... | ... |
| 203 | Virolahti Koivuniemi | 101231 | 27.67 | 60.53 |
| 204 | Virrat Äijänneva | 101310 | 23.54 | 62.33 |
| 205 | Ylitornio Meltosjärvi | 101908 | 24.65 | 66.53 |
| 206 | Ylivieska airfield | 101690 | 24.72 | 64.05 |
| 207 | Ähtäri Inha | 101520 | 24.14 | 62.55 |
208 rows × 4 columns
3.5. 1.2 Get data and visualized
get data according to weather parameters or several localisation
[8]:
logging.disable(sys.maxsize)
exclude=[137188,101649,855522,137189,126737]
list_station=[int(id) for id in fmi.stations.id if not int(id) in exclude]
[9]:
ds=fmi.data(parameters=[1002,3002],
            stationId=list_station,
            timeZone="Europe/Oslo",savecache=True,usecache=True)
ds
[9]:
<xarray.Dataset>
Dimensions:   (location: 203, time: 505)
Coordinates:
  * location  (location) int64 100683 100907 100908 ... 806428 852678 874863
  * time      (time) datetime64[ns] 2020-06-12 ... 2020-07-03
    lat       (location) float64 60.3 60.13 59.78 59.96 ... 66.17 60.29 60.18
    lon       (location) float64 25.55 19.9 21.37 19.95 ... 29.14 24.57 24.79
Data variables:
    1002      (time, location) float64 15.3 9.4 13.6 12.8 ... 0.1 6.8 12.5 13.8
    3002      (time, location) float64 74.0 84.0 92.0 84.0 ... 85.0 99.0 96.0
Attributes:
    weatherRessource:  Finnish Meteorological Institute measured data
    timeStart:         2020-06-12T00:00:00.000000000
    timeEnd:           2020-07-03T00:00:00.000000000
parameters: ['1002', '3002']Visualization
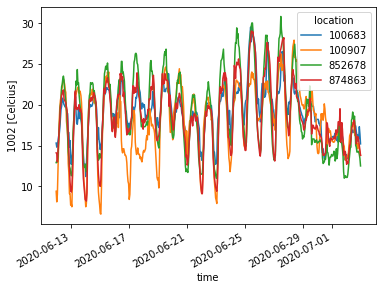
[10]:
fmi.plot(ds,varname='1002',location=[100683,100907,852678,874863],resample=None)
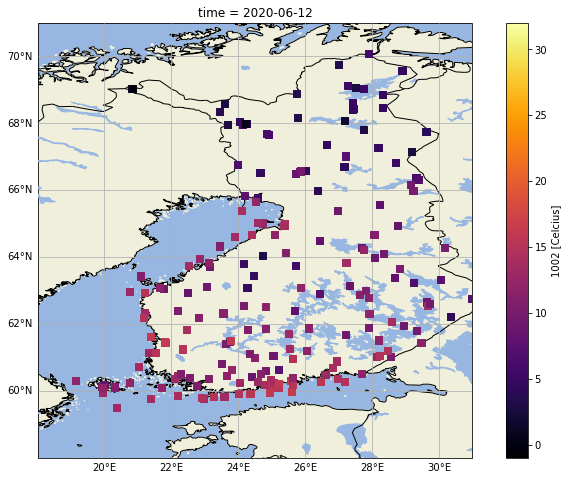
[11]:
fmi.station_plot(ds=ds, varname="1002",time=0,resample=None)
4. 2. Add local OpenAlea ressouce to local IPM catalog
import local data
[12]:
data=ws.__data_reader__(r'C:\Users\mlabadie\Documents\GitHub\weatherdata\example\Boigneville_2012_2013_h.csv')
data
[12]:
| temperature_air | relative_humidity | rain | wind_speed | global_radiation | |
|---|---|---|---|---|---|
| 2012-09-01 00:00:00 | 8.6 | 74.5 | 0.0 | 1.666667 | 0.0 |
| 2012-09-01 01:00:00 | 7.5 | 76.5 | 0.0 | 1.666667 | 0.0 |
| 2012-09-01 02:00:00 | 7.5 | 78.0 | 0.0 | 1.388889 | 0.0 |
| 2012-09-01 03:00:00 | 7.0 | 80.0 | 0.0 | 1.111111 | 0.0 |
| 2012-09-01 04:00:00 | 6.7 | 81.0 | 0.0 | 1.388889 | 0.0 |
| ... | ... | ... | ... | ... | ... |
| 2013-08-31 19:00:00 | 18.3 | 74.5 | 0.0 | 0.833333 | 0.0 |
| 2013-08-31 20:00:00 | 17.8 | 78.5 | 0.0 | 1.666667 | 0.0 |
| 2013-08-31 21:00:00 | 17.9 | 78.0 | 0.0 | 2.222222 | 0.0 |
| 2013-08-31 22:00:00 | 17.0 | 77.0 | 0.0 | 2.777778 | 0.0 |
| 2013-08-31 23:00:00 | 15.9 | 75.0 | 0.0 | 3.611111 | 0.0 |
8760 rows × 5 columns
Add the local_ressources
[13]:
ws.add_local_ressource(name="Mydata",
                       data=data,
                       latitude=3.876716,
                       longitude=43.610769,
                       altitude=0,
                       convert_name={"temperature_air":1001,
                                     "relative_humidity":3001,
                                     "rain":2001,
                                     "wind_speed":4005,
                                     "global_radiation":5001})
[13]:
| 1001 | 3001 | 2001 | 4005 | 5001 | |
|---|---|---|---|---|---|
| 2012-09-01 00:00:00 | 8.6 | 74.5 | 0.0 | 1.666667 | 0.0 |
| 2012-09-01 01:00:00 | 7.5 | 76.5 | 0.0 | 1.666667 | 0.0 |
| 2012-09-01 02:00:00 | 7.5 | 78.0 | 0.0 | 1.388889 | 0.0 |
| 2012-09-01 03:00:00 | 7.0 | 80.0 | 0.0 | 1.111111 | 0.0 |
| 2012-09-01 04:00:00 | 6.7 | 81.0 | 0.0 | 1.388889 | 0.0 |
| ... | ... | ... | ... | ... | ... |
| 2013-08-31 19:00:00 | 18.3 | 74.5 | 0.0 | 0.833333 | 0.0 |
| 2013-08-31 20:00:00 | 17.8 | 78.5 | 0.0 | 1.666667 | 0.0 |
| 2013-08-31 21:00:00 | 17.9 | 78.0 | 0.0 | 2.222222 | 0.0 |
| 2013-08-31 22:00:00 | 17.0 | 77.0 | 0.0 | 2.777778 | 0.0 |
| 2013-08-31 23:00:00 | 15.9 | 75.0 | 0.0 | 3.611111 | 0.0 |
8760 rows × 5 columns
The ressources has been added at the local catalog to be used like any other ressources of the catalog
[14]:
ws.list_resources
[14]:
| name | description | parameters | |
|---|---|---|---|
| 0 | Met Norway Locationforecast | 9-day forecasts for the entire planet. 2.5 km resolution in the Nordic-Baltic region, 9km elsewhere | {'common': [1001, 3001, 2001, 4002], 'optional': None} |
| 1 | Met Éireann Locationforecast | 9-day forecasts for Ireland. | {'common': [1001, 3001, 2001, 4002], 'optional': None} |
| 2 | DMI Pointweather service | Seasonal weather data and forecasts for Denmark. Grid based | {'common': [1002, 1112, 2001, 3002, 3101, 4002], 'optional': None} |
| 3 | SLU Lantmet service | Seasonal weather data and forecasts for Sweden. Grid based | {'common': [1002, 1003, 1004, 2001, 3002, 3003, 3004, 4003, 5001], 'optional': None} |
| 4 | Deutsche Wetterdienst location forecast by IPM Decisions | 27 hour weather forecasts for Germany and surrounding areas. 2.5 km resolution. Pulls data from DWD's Open Data server (https://www.dwd.de/EN/ourservices/opendata/opendata.html). Made available by a custom adapter created by Met Norway and NIBIO. | {'common': [1001, 3001, 2001, 4002], 'optional': None} |
| ... | ... | ... | ... |
| 11 | MeteoBot API | Network of privately owned weather stations. Access requires permission from each weather station's owner | {'common': [1001, 3001, 2001, 4002], 'optional': None} |
| 12 | Fruitweb | Network of privately owned weather stations of several types; Davis, Metos and self manufactured. Access requires permission from each weather station's owner | {'common': [1001, 3001, 2001, 4002], 'optional': None} |
| 13 | Metos | Network of privately owned weather stations of several types; Davis, Metos and self manufactured. Access requires permission from each weather station's owner | {'common': [1001, 3001, 2001, 4002], 'optional': None} |
| 14 | Meteodata by Météo Concept | Weather station network covering all of mainland France, with a specially high density of agricultural stations in Brittany. Visit www.meteodata.fr and www.meteo-concept.fr or email us at contact@meteo-concept.fr | {'common': [1001, 2001, 3001, 4001, 4003], 'optional': [1003, 1004, 1021, 1101, 1131, 3003, 3004, 3101, 5001]} |
| 15 | Mydata | personal data | {'common': [1001, 3001, 2001, 4005, 5001], 'optional': None} |
16 rows × 3 columns
[15]:
personal_data=ws.get_ressource(name="Mydata")
ds=personal_data.to_ipm(display="ds")
ds
[15]:
<xarray.Dataset>
Dimensions:   (time: 8760, location: 1)
Coordinates:
  * time      (time) datetime64[ns] 2012-08-31T22:00:00 ... 2013-08-31T21:00:00
  * location  (location) <U21 '[3.876716, 43.610769]'
    lat       (location) float64 3.877
    lon       (location) float64 43.61
Data variables:
    1001      (time, location) float64 8.6 7.5 7.5 7.0 ... 17.8 17.9 17.0 15.9
    3001      (time, location) float64 74.5 76.5 78.0 80.0 ... 78.0 77.0 75.0
    2001      (time, location) float64 0.0 0.0 0.0 0.0 0.0 ... 0.0 0.0 0.0 0.0
    4005      (time, location) float64 1.667 1.667 1.389 ... 2.222 2.778 3.611
    5001      (time, location) float64 0.0 0.0 0.0 0.0 0.0 ... 0.0 0.0 0.0 0.0
Attributes:
    weatherRessource:  Mydata
    timeStart:         2012-08-31T22:00:00.000000000
    timeEnd:           2013-08-31T21:00:00.000000000
parameters: ['1001', '3001', '2001', '4005', '5001'][16]:
personal_data.plot(ds,varname="1001",resample="d")

[ ]: